
This is the Level 0 picture, its aimed at defining the overall context of the business and the primary service. Some organisations may have a few services at level 0, most however will have either 1 or 2 that really define what the business is all about. This is the "Chairman" and shareholder level picture
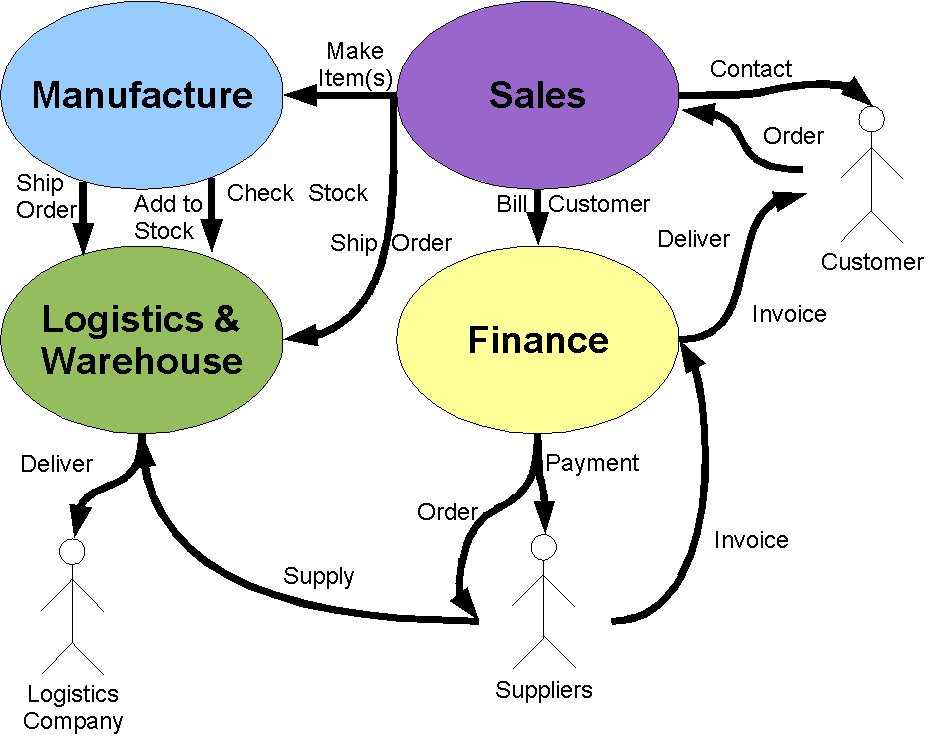
And this is the Level 1 that breaks the picture down to the next level of how the business starts to deliver for those services. This shows the "What" (Services), "Who" (external organisations/actors) and "Why" (reasons actors/services interact). Level 1 is the CxO level as its here that the high level trackers are defined. As an example the number of items shipped, outstanding invoices etc are all at this very top level. The method is very simple and doesn't talk about the actual "How". The purpose is simple, if you don't know what the big picture is, how are you ever going to know what needs to be delivered?
I'm going to be using this approach within Blueprints (for example we are working on an example SOA company to create an SOA business blueprint) and we're looking at working with the vendors around getting tool support.
No comments:
Post a Comment