Showing posts with label performance. Show all posts

Friday, July 01, 2011

Has de-normalisation had its day?

Ever since the relational database became king there has been a mantra in IT and information design.  De-normalisation is critical to the effective use of information in both transactional and, particularly, analytical systems.  The reason for de-normalisation is to do with the issues around read performance in relational models.  De-normalisation is always an increase in complexity over the business information model and its done for performance reasons alone.

But do we need that anymore?  For three reasons I think the answer is, if not already no, then rapidly becoming no.  Firstly its to do with the evolution of information itself and the addition of caching technologies, de-normalisation's performance creed is becoming less and less viable in a world where its actually the middle tier that drives the read performance via caching and the OO or hierarchical structures that these caches normally take.  This is also important because the usage of information changes and thus the previous optimisation becomes a limitation when a new set of requirements come along.  Email addresses were often added, for performance reasons, as child records rather than using a proper "POLE" model, this was great... until email became a primary channel.  So as new information types are added the focus on short term performance optimisations causes issues down the road directly because of de-normalisation.

The second reason is Big Data taking over in the analytical space.  Relational models are getting bigger but so are approaches such as Hadoop which encourage you to split the work up to enable independent processing.  I'd argue that this suits a 'normalised' or as I like to think of it "understandable" approach for two reasons.  Firstly the big challenge is often how to break down the problem, the analytics, into individual elements and that is easier to do when you have a simple to understand model.  The second is that grouping done for relational performance don't make sense if you are not using a relational approach to Big Data.

The final reason is to do with flexibility.  De-normalisation optimises information for a specific purpose which was great if you knew exactly what transactions or analytics questions would be answered but is proving less and less viable in a world where we are seeing ever more complex and dynamic ways of interacting with that information.  So having a database schema that is optimised for specific purpose makes no sense in a world where the questions being asked within analytics change constantly.  This is different to information evolution, which is about new information being added, but is about the changing consumption of the same information.  The two elements are most certainly linked but I think its worth viewing them separately.  The first says that de-normalisation is a bad strategy in a world where new information sources come in all the time, the later says its a bad reason if you want to use you current information in multiple ways.

In a world where Moore's Law, Big Data, Hadoop, Columnar databases etc are all in play isn't it time to start from an assumption that you don't de-normalise and instead model information from a business perspective and then most closely realise that business model within IT?  Doing this will save you money as new sources become available, as new uses for information are discovered or required and because for many cases a relational model is no-longer appropriate.

Lets have information stored in the way it makes sense to the business so it can evolve as the business needs, rather than constraining the business for the want of a few SSDs and CPUs.

Technorati Tags: ,

Monday, February 02, 2009

When to switch to static

One of the bits I always find funny is the "X scales" pitch, whether it be stateless EJBs, REST or anything else its always one of the magic phrases. Mainframes scale, really quite effectively, they handle some very impressive numbers. Those Blue-Gene systems from IBM seem to scale pretty well too.

The key to the claims at scaling in most of these things is that you can throw more tin at the problem. Often this ignores the fact that there is a chumping database behind the scenes where scaling is a bit tricker, and more expensive, or they do smarts like Amazon's S3. The point is though that sometimes the unexpected happens and you have two options.

1) Scale to the possible peak that occurs in an exceptional circumstance
2) Prepare a static page for the exceptional circumstance

Sometimes, for instance if your website is the way you handle customers in the exceptional case, you have to go for the peak. Lots of times however its about getting information out.

As an example, the South East of the UK today was brought to a halt by the sort of snow levels that people in Boston would consider a "flurry" and the folks in Scandinavia would just shrug and walk on. This brought lots of the various sites down, for instance SouthEastern (my local rail company) had their site offline for most of the day.

What did they need to tell me? ALL TRAINS ARE CANCELLED INTO LONDON. But their dynamic site couldn't handle it. Later in the day they switched over to a PHP solution with a minimal (single) page on it but it took a good half of the day.

This is why people should always think about the ultimate fail-over for their sites. Sure you've scaled to some peak, but what if the worst happens and you get treble that peak? The answer is to switch to a file based approach, load that file into memory and just serve it as fast as you can, its amazing how many connections you can support when you are just returning a single static memory loaded page.

Some people will say "scale to that extraordinary peak" but you know what? 99.99% of the people hitting the site were looking for the same single piece of information and saying "normal service will be resumed once the snow has melted" would have been fine for the one random person looking to visit their aunt next June.

Failure conditions don't always mean that you site hasn't failed, it means that you've coped with that failure in a smart way.

Technorati Tags: ,

Saturday, October 18, 2008

Now we're caching on GAs

GAs = Google AppEngineS. Rubbish I know but what the hell. So I've just added in Memcache support for the map so now its much much quicker to get the map. Now the time taken to do these requests isn't very long at all (0.01 to do the mandelbrot, 0.001 to turn it into a PNG) but the server side caching will speed up the request and lead to it hitting the CPU less often...

Which means that we do still have the option of making the map squares bigger now as it won't hit the CPU as often, which means we won't violate the quota as often.

So in other words performance tuning for the cloud is often about combining different strategies rather than one strategy that works. Making the squares bigger blew out the CPU quota, but if we combine it with the cache then this could reduce the number of times that it blows the quota and thus enables it to continue. This still isn't effecting the page view quota however and that pesky ^R forces a refresh and the 302 redirect also makes sure that its still hitting the server, which is the root of the problem.

Technorati Tags: ,

Google App Engine performance - Lots and Lots of threads

Just a quick one here. While Google App Engine's Python implementation limits you to a single thread it certainly isn't running a single thread and servicing requests from it. When running locally (where the performance per image is about the same) it certainly does appear to be single threaded as it takes an absolute age and logs are always one request after another. On the server however its a completely different case with multiple requests being served at the same time. This is what the Quota Breaking graphs seem to indicate as its servicing 90 requests a second which would seem to indicate that the App Engine just starts a new thread (or pulls from a thread pool) for each new request and is spreading theses requests across multiple CPUs. The reason I say that later piece is that the performance per image is pretty much the same all the time which indicates each one is getting dedicated time.

So lots of independent threads running on lots of different CPUs but probably sharing the same memory and storage space.

Technorati Tags: ,

Google App Engine, not for Web 2.0?

Redirect doesn't help on quota but something else does...


The block size has increased from 54x54 to 100x100 which still fits within the quota at the normal zoom (but is liable to break quota a bit as we zoom in). This moves the number of requests per image down from 625 to 225 which is a decent drop. Of course with the redirect we are at 450 but hopefully we'll be able to get that down with some more strategies.

The point here is that when you are looking to scale against quotas it is important to look at various things not simply the HTTP related elements. If you have a page view quota the easiest thing to do is shift bigger chunks less often.

One point that this does mean however is that Google App Engine isn't overly suited to Web 2.0 applications. It likes big pages rather than having a sexy Web 2.0 interface with lots and lots of requests back to the server. GMail for instance wouldn't be very good on App Engine as its interface is always going back to the server to get new adverts and checking for new emails.

So when looking at what sort of cloud works for you, do think about what sort of application you want to do. If you are doing lots of Web 2.0 small style AJAX requests then you are liable to come a cropper against the page view limit a lot earlier than you thought.

Technorati Tags: ,

Redirecting for caching - still not helping on quota

As I said, redirect isn't the solution to the problem but I thought I'd implement it anyway, after all when I do fix the problem its effectively a low cost option anyway.


What this does is shifts via a redirect (using 302 rather than 301 as I might decide on something else in future and let people render what ever they want) to the nearest "valid" box. Valid here is considered to be a box of size (width and height) of a power of 2 and based around a grid with a box starting at 0,0. So effectively we find the nearest power of 2 to the width then just move down from the current point to find the nearest one. Not exactly rocket science and its effectively doubling the number of hits.

Technorati Tags: ,

Friday, October 17, 2008

Caching strategies when redirect doesn't work

So the first challenge of cachability is solving the square problem. Simply put the created squares need to be repeatable when you zoom in and out.

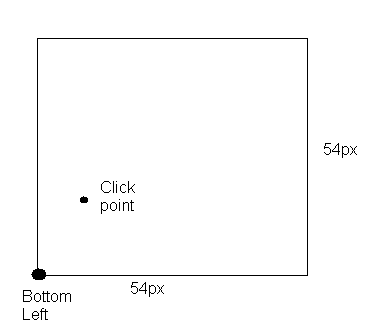
So the calculation today is just find the click point and find the point halfway between that and the bottom left to give you the new bottom left.

The problem is that this is unique. So what we need to find is the right bottom left that is nearest to the new bottom left.


Now one way to do this would be to do a 301 redirect for all requests to the "right" position. This is a perfectly valid way of getting people to use the right resource and of limiting the total space of the resource set. What you are saying in effect is that a request for resource X is in fact a request for resource Y and you should look at the new place to get it. This works fine in this scenario but for one minor problem.

The challenge we have is page views and a 301 redirect counts as a page view, meaning that we'd be doubling the number of page views required to get to a given resource. Valid though this strategy is therefore it isn't the one that is going to work for this cloud application. We need something that will minimise the page views.

But as this is a test.... lets do it anyway!

Technorati Tags: ,

Google App Engine performance under heavy load - Part 4

Okay so the first time around the performance under relatively light load was pretty stable. Now given that we are at the Quota Denial Coral would this impact the performance?


First off look at the scale, its not as bad as it looks. We are still talking normally about a 10% range from Min to Max and even the worst case is 16% which is hardly a major issue. But is this a surprise?

No it isn't. The reason is that because of the quota that we are breaking (page views) we aren't actually stressing the CPU quota as much (although using several milli-seconds a second indicates that we are hitting it quite hard). That said however it is still pretty impressive that in a period of time where we are servicing around 90 requests a second the load behaviour is exactly the same, or arguably more stable as the min/max gap is more centred around the average, than when it is significantly lower.

So again the stability of performance of App Engine is looking pretty good independent of the overall load on the engine.

Technorati Tags: ,

Thursday, October 16, 2008

HTTP Cache and the need for cachability

One of the often cited advantages of REST implemented in HTTP is the easy access to caching which can improve performance and reduce the load on the servers. Now with breaking app engine quota regularly around Mandel Map the obvious solution is to turn on caching. Which I just have by adding the line

self.response.headers['Cache-Control'] = 'max-age=2592000'


Which basically means "don't come and ask me again for a week". Now part of the problem is that hitting reload in a browser forces it to go back to a server anyway but there is a second and more important problem as you mess around with the Map. With the map, double click and zoom in... then hold shift and zoom out again.


Notice how it still re-draws when it zooms back out again? The reason for this is that the zoom in calculation just works around a given point and sets a new bottom left of the overall grid relative to that point. This means that every zoom in and out is pretty much unique (you've got a 1 in 2916 chance of getting back to the cached zoom out version after you have zoomed in).

So while the next time you see the map it will appear much quicker this doesn't actually help you in terms of it working quicker as it zooms in and out or in terms of reducing the server load for people who are mucking about with the Map on a regular basis. The challenge therefore is designing the application for cachability rather than just turning on HTTP Caching and expecting everything to magically work better.

The same principle applies when turning on server side caching (like memcache in Google App Engine). If every users gets a unique set of results then the caching will just burn memory rather than giving you better performance, indeed the performance will get slower as you will have a massively populated cache but have practically no successful hits from requests.

With this application it means that rather than simply do a basic calculation that forms the basis for the zoom it needs to do a calculation that forms a repeatable basis for the zoom. Effectively those 54x54 blocks need to be the same 54x54 blocks at a given zoom level for every request. This will make the "click" a bit less accurate (its not spot on now anyway) but will lead to an application which is much more effectively cachable than the current solution.

So HTTP Cache on its own doesn't make your application perform any better for end users or reduce the load on your servers. You have to design your application so the elements being returned are cachable in a way that will deliver performance improvements. For some applications its trivial, for others (like the Mandelbrot Map) its a little bit harder.


Technorati Tags: ,

Wednesday, October 15, 2008

Google App Engine - Quota breaking on a normal day

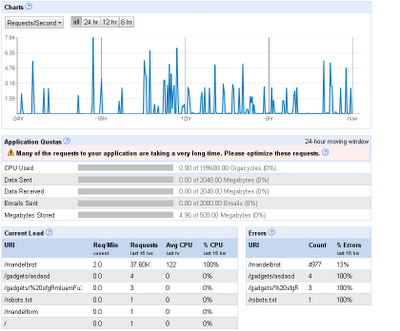
Okay after yesterday's quota smashing efforts I turned off the load testing and just let the normal website load go but with the "standard image" that I use for load profiling being requested every 30 seconds. That gives a load of less than 3000 requests in addition to the Mandel Map and gadget requests.

So its pretty clear that requests are WAY down from yesterday at a peak of under 8 requests a second which is down from a sustained load of around 90 requests a second. So how did this impact the quota? Well it appears that once you break the quota that you are going to get caught more often, almost like you get onto a watch list.
Interestingly though you'll note that again the denials don't match straight to demand. There is a whole period of requests where we have no denials and then it kicks in. This indicates that thresholds are being set for periods of time which are fixed rather than rolling, i.e. you have a 24 hour block that is measured and that then sets the quota for the next 24 hour block rather than it being a rolling 24 hour period (where we'd expect to see continual denails against a constant load).
Megacycles are again high on the demand graph but non-existant on the quota graph and the denails don't correspond directly to the highest CPU demand periods. So it does appear (to me) that the CPU piece isn't the issue here (even though its highlighting the number of 1.3x quota requests (that standard image)) but more testing will confirm that.

The last test was to determine whether the data measurement was actually working or not. Again we see the demand graph showing lots of data going forwards and backwards with nearly 4k a second being passed at peak. It takes about 3 Mandel Map requests to generate 1MB of data traffic so it certainly appears that right now Google aren't totting up on the Bandwidth or CPU fronts, its about the easy metrics of page requests and actual time. They are certainly capturing the information (that is what the demand graphs are) but they aren't tracking it as a moving total right now.

Next up I'll look at the performance of that standard image request to see if it fluctuates beyond its 350 - 400 milliseconds normal behaviour. But while I'm doing that I'll lob in some more requests by embedding another Mandel Map


Technorati Tags: ,

Google App Engine - breaking quota in a big way

Okay so yesterday's test was easy. Set four browsers running with the Reload plug-in set for every 10 seconds (with one browser set to 5 seconds). This meant that there would be 18,780 hits a minute. Now there are a bunch of quotas on Google App Engine and as I've noticed before its pretty much only the raw time one
that gets culled on an individual request.

So it scales for the cloud in terms of breaking down the problem but now we are running up against another quota. The 5,000,000 page views a month. This sounds like a lot, and it would be if each page was 1 request, but in this AJAX and Web 2.0 each page can be made of lots of small requests (625 images + the main page for starters). Now Google say that they throttle before your limit rather than just going up to it and stopping... and indeed they do.

That shows the requests coming in. Notice the two big troughs? That could be the test machines bandwidth dropping out for a second, or an issue on the App Engine side. More investigation required. That profile of usage soon hit the throttle

This looks like you can take a slashdotting for about 2 hours before the throttle limit kicks in. The throttle is also quickly released when the demand goes down. The issue however here is that it isn't clear how close I am to a quota and how much I have left, there isn't a monthly page count view and, as noted before, the bandwidth and cycles quotas don't appear to work at the moment
It still says I've used 0% of my CPU and bandwidth which is a little bit odd given this really does cane the CPU. Bug fixing required there I think!

So basically so far it appears that App Engine is running on two real quotas, one is the real time that a request takes and the other is related to the number of page views. If you are looking to scale on the cloud it is important to understand the metrics you need to really measure and those which are more informational. As Google become tighter on bandwidth and CPU then those will become real metrics but for now its all about the number of requests and the time those requests take.

Technorati Tags: ,

Monday, October 13, 2008

Google App Engine - How many megas in a giga cycle?

Well the Mandel Map testing is well underway to stress out the Google cloud. 12 hours in and there is something a bit odd going on....


Notice that the peak says that it was doing 4328 megacycles a second, and its generally been doing quite a bit with the 1000 megacycle a second barrier being broached on several occasions.

Now for the odd bit. According to the quota bit at the bottom I've used up 0.00 Gigacycles of my quota. Now the data one looks a little strange as well as it is firing back a lot of images and its not registering at all. So despite all of that load I've apparently not made a dent in the Google Apps measurements for CPU cycles or for data transfer. To my simple mind that one peak of 4328 megacycles should be around 4 Gigacycles however you do the maths. It really does seem to be a staggering amount of CPU and bandwidth that is available if all of this usage doesn't even make it to the 2nd decimal place of significance.

So here it is again to see if this helps rack up the numbers!


Technorati Tags: ,

Monday, June 30, 2008

Google App Engine performance - Part 3

Okay so the last piece was just when does it cut off in pure times perspective?

Shows the various daily peaks and having done a bit more detailed testing the longest has been 9.27 seconds with several going above the 9 seconds mark. These are all massively over the CPU limit but it appears that the only real element that gets culled is the raw time. Doing some more work around the database code at the moment and it appears that long queries there are also a pretty big issue, especially when using an iterator. The best bet is to do a fetch on the results and then use those results to form the next query rather than moving along the offsets, in other words if you are ordering by date (newest to oldest) then do a fetch(20) and take the time of the last element in the results and on the next query say "date>last.date". Fetch is certainly your friend in these scenarios.

So what does this mean? Well Google aren't culling at the CPU limit straight away but are consistent around the time limit, the performance doesn't have peaks and troughs through the day and there doesn't seem to be any swapping out of CPU intensive tasks. All in all its a solid base.

Finally however I just had to lob on something from Google Spreadsheets that brings how the sort of thing that people can do when they have access to real time data and decent programming frameworks.

This just shows the progression of the "default" render over time, if you go by "average" then it will show you the stability that occurs and if you go by count then it shows the amount of calculations that all of these stats have been gleaned form and will help you think whether its a decent enough set of data to draw conclusions from.


Technorati Tags: ,

Wednesday, June 25, 2008

Google App Engine performance - Part 2

So the first analysis was to look at the gadget performance with 40,000 pixels which gives a fair old number of calculations (its 16 iterations for those that want to know). My next consideration was what would happen to a larger image that was further over the threshold. Would that see more issues?


Again its that cliff (I need to go and look at the code history) but again its remarkably stable after that point.


I know I shouldn't be surprised but this is several times over the CPU Quota limit (about 5 times in fact) so I was expecting to see a bit more variation as it caned the processor.


Now this shows just how consistent the processing is. Its important to note here that this isn't what Google App Engine is being pitched at right now. Given they've pitched it at data read intensive apps I'm impressed at just how level the capacity is. Having a 2 x standard deviation that is sitting around +/- 2% and even the "exceptional" items only bumping up around the 5% mark is indication either of a load of spare capacity and therefore not much contention or some very clever loading.

The penultimate bit I wanted to see was whether the four fold increase in calculations resulted in a linear increase in time.


What this graph shows is the raw performance and then the weighting (i.e. blog performance divided by 4). Zooming in on comparing the blog (160000 pixel) weighted against the straight off 40000 pixel gadget we get

Which very impressively means that there is a slight (that really is a fraction of 1% not 0.5 = 50%) performance gain through doing more calculations. Its not enough to be significant but it is enough to say that the performance is pretty linear even several times above the performance quota. The standard deviations are also pretty much in line which indicates a decent amount of stability at this level.

So while this isn't a linear scalability test in terms of horizontal scaling it does indicate that you are pretty much bound to 1 CPU and I'm not seeing much in the way of swapping out (you'd expect the Max/Min and the std dev on the larger one to be higher if swapping was a problem). So either Google have a massive bit of spare capacity or are doing clever scheduling with what they have.

The final question is what is the cut off point....

Technorati Tags: ,

Google App Engine performance - Part 1

Okay its been a few weeks now and I thought I'd take a look at the performance and how spiky it was. The highest hit element was the gadget with a few thousand hits so I took the data from the "default" image (-2,-1), (1,1) and looked at the performance over time.


Are all of the results over time. I'm not quite sure if that cliff is a code optimisation or is Google doing a step-fold increase but the noticeable element is that after the spike its pretty much level. Delving into the results further the question was whether there was a notable peak demand time on the platform which impacted the application.


The answer here looks like its all over the place on the hours, but the reality is that its the first few days that are the issue and in reality the performance is within a fairly impressive tolerance

Beyond the cliff therefore the standard deviation and indeed the entire range is remarkably constrained within about +/- 5% for min/max of average and two standard devs being +/- 2% of the average. These performances are the ones that within 1.2 times of the Google App Engine Quota Limit in terms of CPU so you wouldn't expect to see much throttling. The next question therefore is what happens under higher load...

Technorati Tags: ,

Friday, October 19, 2007

How to create performant Web Services and XML

I was at an event the other day when a chap said that XML/Web Services etc were fine "unless you wanted to do thousands of transactions a minute in which case you needed something much more streamlined".
Now I was sitting at a table at the time and we all pretty much agreed the statement was bollocks. So I thought I'd do a quick guide to create performant Web Services and XML applications.
  1. Use XML at the boundaries. If you are writing Java/C/Ada/Python/Ruby etc then once you've made the hit to translate into your native language... keep it there. When you cross another service boundary then that probably needs XML, but don't keep marshalling to/from XML every time you move around inside a service.
  2. KISS. If you have 25 XSLTs and indirections in your ESB then it will run like a dog
  3. Don't have a central bus that everything goes through, think federation
Oh and of course the most important one
  1. BUY HARDWARE
Seriously, hardware is cheap so my basic rule (and it hasn't failed yet) is as follows:

If you are out by a low multiple (under 3) or a few percentage points then scale your XML processing like a Web site (lots of thin servers at the front). If you are out by high multiples then you've screwed up somewhere.

Now the later one can be that the vendor has screwed up, so make them fix it. But in the last 7 years of doing XML and Web Services I can say that in environments running lots and lots of transactions (thousands a second even) that I've yet to find that XML and Web Services didn't scale.

The key if you have a performance problem is to really look at the pipeline and see where the real time is being spent. Several times I've had people claim "Web Service performance issues" then found that 1ms is being spent in the WS bit and 5 seconds in the application, or people blaming a specific element (XSLT/XML parser/etc) and then finding out that it is a bug in an implementation (one in a certain vendors stack looked almost like a wait loop bug). These elements aren't performance issues with Web Services or XML, they are bugs and issues with the applications and implementations.

XML and Web Services are not the most efficient things in the world. But then I'm currently working on a computer where this browser (inefficient editor) is running in side a VM (inefficient) on a box with 3 other VMs running on it (very inefficient)... and it is still working fine. A home computer now comes for a reasonable price with FOUR CPUs inside it (remember when a front end started at 4 x 1 CPU systems?) and Moores Law continues to run away. The issue therefore isn't whether XML/WS (or event XML/REST) is the most efficient way of running something but whether it is good enough to be used. New approaches such as streaming XML take the performance piece on still further and make it even less of an issue than it was before. This is about changing the libraries however and not the principles. XML/Web Service works from a server perspective.

So server processing isn't the issue. So maybe its network bandwidth... again I'd say no. Lob on gzip and you will burn up some more CPUs but again that is cheap in comparison with spending a bunch of time writing, testing and debugging software. This creates a much lighter over the wire message and again just seems to be fine in implementations where the wire size is important.

The only piece I've found that continues to be an issue is something that is nothing to do with Web Services or XML, but which is more of an issue in REST, and that is chatty behaviour over the network. Being chatty over a network gives latency, no matter what your bandwidth is there will still be a degree of latency and you can't get away from that.

So basically the solution is to communicate effectively and accurately and to do so in reasonably coarse grained ways. This is hardly news at all as it has applied to all communication systems in IT. As networks speed up and latency comes down then maybe even this will become less of a problem, but for today its certain a place to avoid excess. Google for instance on a second search (cached) to "Steve Jones SOA blog" responds in 80ms. A coarse grained approach that has 1 interaction per request and 10 requests will have a network induced lag of at least 800ms, a chatty approach that has 5 interactions per request will have 4000ms or 4 seconds. Chatty = non performant.

So basically I've found that Web Services and XML do scale, hardware is cheap, that Stupidity doesn't scale and that networks still introduce latency.

Its not rocket science but some people seem to think that its still 1999.

Technorati Tags: ,

Friday, June 22, 2007

YAGNI, Requirements and why scaling isn't always important

I've had a few discussions recently where people have gone on about using approach X (o r R) because it would give "full security", "massive scalability" or some other non-functional nirvana. This is normally said without actually asking what the requirements are and a response from me of "but it doesn't need that sort of security" or "its only got one user" is met with "you must prepare for the future, what if it goes on the internet tomorrow?".

This is a classic technical argument, and one that is hugely divorced from business reality. Having the perfect solution for a business problem does not mean that the solution has the "best" technical architecture, it means that it is good enough for the job.

Scalability is the easiest place to over engineer solutions. Back in 2001 I architected a solution that used stateful web services, I did this as the web service provided a security session into the back end application (basically if you didn't authenticate then the service wasn't connected to the backend). It worked a treat, scaled fine because there was only one consumer of the service they were a call centre and they had a single point of interaction with the service and all their requests went through that one session. It worked, it went live. Would it scale to 10,000 users? Nope. But then that was NEVER in the business case and was NEVER going to happen.

By separating the backend from the information exchange it then becomes possible to have different interfaces on the same logic that provide different scaling approaches. All to often however people want to architect the whole system based around that information exchange.

Split information exchange from the business services, and worry about the scaling that is appropriate for your information exchange. Don't worry about technical purity and some "wonder" architectural approach. Don't over engineer because if you do X (or R) then it will scale to 100,000 users, but your requirements say "6".

Business requirements should drive your decisions on scalability, not a technical discussion on what is possible. Scale to what is needed, not to what is dreamt.

Obsession with technical purity is a major challenge in IT, and its unlikely the business will take IT people seriously while they continue to obsess about things that don't have business requirements.


Technorati Tags: ,