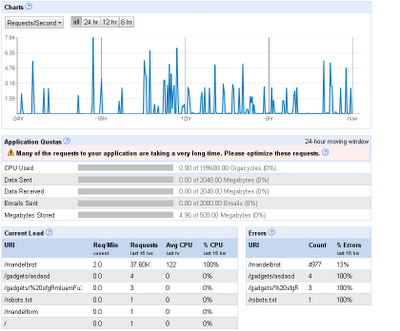
So its pretty clear that requests are WAY down from yesterday at a peak of under 8 requests a second which is down from a sustained load of around 90 requests a second. So how did this impact the quota? Well it appears that once you break the quota that you are going to get caught more often, almost like you get onto a watch list.
 Interestingly though you'll note that again the denials don't match straight to demand. There is a whole period of requests where we have no denials and then it kicks in. This indicates that thresholds are being set for periods of time which are fixed rather than rolling, i.e. you have a 24 hour block that is measured and that then sets the quota for the next 24 hour block rather than it being a rolling 24 hour period (where we'd expect to see continual denails against a constant load).
 Megacycles are again high on the demand graph but non-existant on the quota graph and the denails don't correspond directly to the highest CPU demand periods. So it does appear (to me) that the CPU piece isn't the issue here (even though its highlighting the number of 1.3x quota requests (that standard image)) but more testing will confirm that.
 The last test was to determine whether the data measurement was actually working or not. Again we see the demand graph showing lots of data going forwards and backwards with nearly 4k a second being passed at peak. It takes about 3 Mandel Map requests to generate 1MB of data traffic so it certainly appears that right now Google aren't totting up on the Bandwidth or CPU fronts, its about the easy metrics of page requests and actual time. They are certainly capturing the information (that is what the demand graphs are) but they aren't tracking it as a moving total right now.
Next up I'll look at the performance of that standard image request to see if it fluctuates beyond its 350 - 400 milliseconds normal behaviour. But while I'm doing that I'll lob in some more requests by embedding another Mandel Map
Technorati Tags: SOA, Service Architecture
No comments:
Post a Comment